HOW TO USE FIBONACCI IN FOREX TRADING
Published by Gbaf News
Posted on June 12, 2015
3 min readLast updated: January 22, 2026

Published by Gbaf News
Posted on June 12, 2015
3 min readLast updated: January 22, 2026

Many technical traders favour methodologies that can accurately predict support, resistance and reversal levels. This is why Fibonacci retracements, which are occasionally called Fibonacci lines, can prove to be a useful addition to a Forex trader’s overall strategy.
So why does a trader need to know support, resistance and reversal levels? Well, these technical indicators are extremely useful in identifying good trading opportunities. More specifically, they assist traders in locating optimal entry points, exit points and reversal points.
Before exploring the mechanics of Fibonacci retracements, let’s take a look at the mathematical concept the technique is based upon. Fibonacci is simply a set sequence of numbers, where each instance is the sum of its two preceding numbers: 1, 1, 2, 3, 5, 8, 13, 21, 34, etc. As the example demonstrates, a Fibonacci sequence can run infinitely.
So how is this mathematical concept applied in Forex trading? It’s through something known as Fibonacci ratios, one of which is known as the ‘golden ratio’.
This happens to be 61.8% – and it’s the pivotal number for Forex traders to keep in mind. Where does this number come from? Simply take any number in the

Fibonacci sequence and divide it by the number that immediately follows it. No matter what number is used from the Fibonacci sequence, the result is always close to a mean average of 0.618. For example, 21 divided by 34 is 0.618 – while 34 divided by 55 is 0.618.
There are two other Fibonacci ratios traders should be aware of: 38.2% (any Fibonacci number divided by the second number immediately following it) and 23.6% (any Fibonacci number divided by the third number immediately following it).
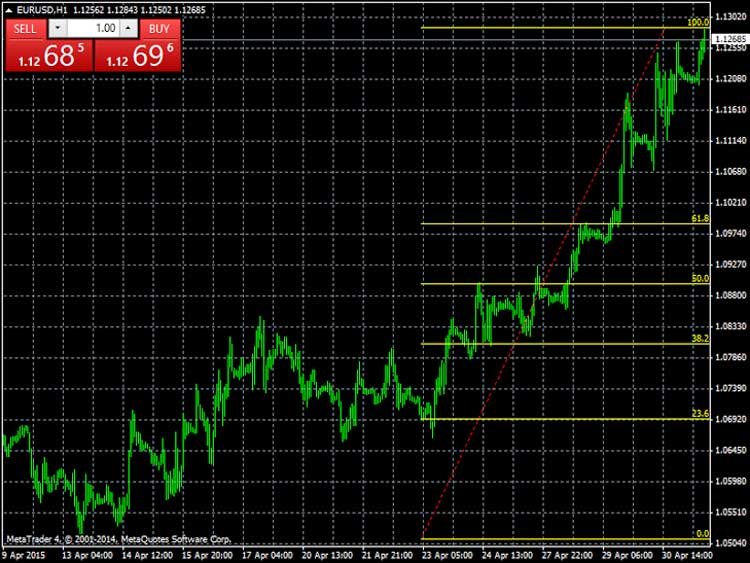
These ratios are important for traders to know, as they are key to understanding how retracement lines are drawn on broker price charts. Most online brokers, including Admiral Markets, allow traders to place technical indicators onto their price charts – including Fibonacci ratios. It’s important to note that brokers also tend to add 50% and 100% as retracement lines.
As is evident in the below example, drawing Fibonacci lines across a price chart reveals potential support and resistance levels, allowing a trader to predict future retracement levels.
While these highlighted levels are useful, they do heavily depend on a trader’s experience in spotting swing-high and swing-low trends. However, Fibonacci retracements can help traders choose an appropriate stop loss level. This is something that many professional traders do.
Written on behalf of Admiral Markets by Darren Sinden.
Explore more articles in the How To category


