H2 2013 SAW DEAL VALUES CONTINUE TO RISE IN EUROPEAN BUY & BUILD
Published by Gbaf News
Posted on April 1, 2014
4 min readLast updated: January 22, 2026

Published by Gbaf News
Posted on April 1, 2014
4 min readLast updated: January 22, 2026

Rising transaction values reflect the favourable financing markets for borrowers
Silverfleet Capital, in conjunction with merger market published the findings of its European Buy & Build Monitor for H2 2013. The Buy & Build Monitor tracks add-on activity undertaken by European companies backed by private equity.
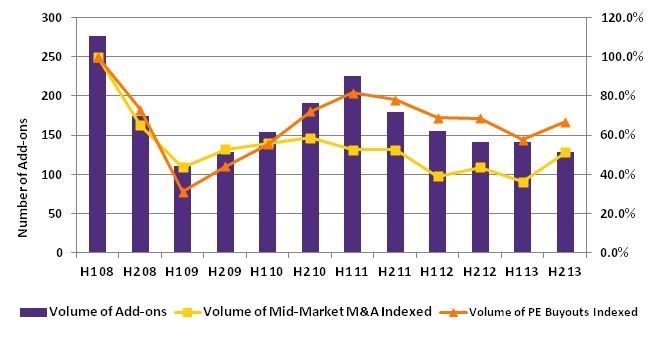
129 add-ons were reported in H2 2013 compared to a H1 number of 141 which has been revised upwards from 124. Further data for smaller Buy & Build transactions usually emerges well after the publication of this report. Therefore, based on our experience, the number of deals in H2 2013 is very likely to be revised upwards in our next report possibly at the expense of the average reported deal size. However, we conclude that activity levels will ultimately have been at least level if not slightly up in the second half of 2013.
The average disclosed value of add-ons in the final quarter, based on the 15 deals with disclosed values reported in that period, was markedly higher, increasing by 56% to £84 million from £54 million for the first three quarters of 2013. The annual average values for add-ons in 2013 and 2012 are £62 million and £46 million respectively.
The largest of the deals in the half year was PAI-backed Swissport’s €450 million purchase of Servisair UK, announced in August 2013. However the increase in average deal values in Q4 2013 is explained by three noteworthy transactions in the final quarter of 2013: The CAD 650 million purchase of Maxxam Analytics by Bureau Veritas, Guardian Financial’s €350 million acquisition of Ark Life, and Aenova’s acquisition of Haupt Pharma for €260 million. Bureau Veritas, Guardian Financial and Aenova are backed respectively by: Wendel, Cinven and BC Partners.
Commenting on the findings, Neil MacDougall, managing partner of Silverfleet Capital said: “During the final quarter of 2013 there was a very noticeable increase in transaction size, with the average deal size at £84 million being the highest since Q1 2011. However, the indications are that the overall number of add-ons will have remained broadly flat compared to the first half of 2013.
Looking in more detail at how two of the larger transactions were financed, Swissport issued a $390 million senior secured add-on note while Aenova raised a €130 million additional term loan. Together these deals demonstrate the keen appetite of both the European high yield and senior debt markets to support large add-ons by private equity-backed companies.”
Below is an updated graph of the half-yearly performance of European add-on volumes shown against mid-market M&A activity and overall European buyout indices, based on data provided by unquote” data.
Historically the volume of add-on deals has been strongly correlated with the volume of private equity funded buyouts in Europe and has broadly tracked the trend in the mid-market M&A index. We therefore expect that this will also be reflected in the final number of add-ons completed in H2 once all the data has been collected.

The table below shows the geographic split of the location of the add-on targets that were acquired in each half of 2013, the total for the year and for 2012. In H2 2013 the Nordic Region was again the most active area, followed by the UK though the UK was noticeably down on an annual basis. German-speaking Europe showed a steady level of activity. France was up slightly in the half but well down on 2012 as a whole. The Benelux region was also subdued. Activity in other parts of Europe was broadly in line with 2012, with the exception of CEE which was up. Add-on activity undertaken outside of Europe was slightly down in North America, usually the favourite target region, but otherwise was consistent with 2012 in other parts of the world.
| Location of target company | 2012 | 2013 | H1 2013 | H2 2013 |
| UK and Ireland | 62 | 48 | 26 | 22 |
| Germany, Switzerland and Austria | 45 | 38 | 19 | 19 |
| France | 39 | 25 | 11 | 14 |
| Nordic Region | 44 | 56 | 29 | 27 |
| Benelux | 26 | 21 | 16 | 5 |
| Spain and Portugal | 12 | 14 | 7 | 7 |
| Italy | 10 | 11 | 7 | 4 |
| Central and Eastern Europe | 10 | 16 | 8 | 8 |
| South Eastern Europe | 4 | 2 | 0 | 2 |
| Total Europe | 252 | 231 | 123 | 108 |
| North America | 23 | 17 | 10 | 7 |
| Asia Pacific | 15 | 13 | 6 | 7 |
| Latin America | 4 | 6 | 2 | 4 |
| Middle East and Africa | 2 | 3 | 0 | 3 |
| Total Rest of World | 44 | 39 | 18 | 21 |
| Total Overall | 296 | 270 | 141 | 129 |
Explore more articles in the Investing category


